PropertyIQ Report · April 2026
730 SE 3rd Terrace, Pompano Beach, FL 33060
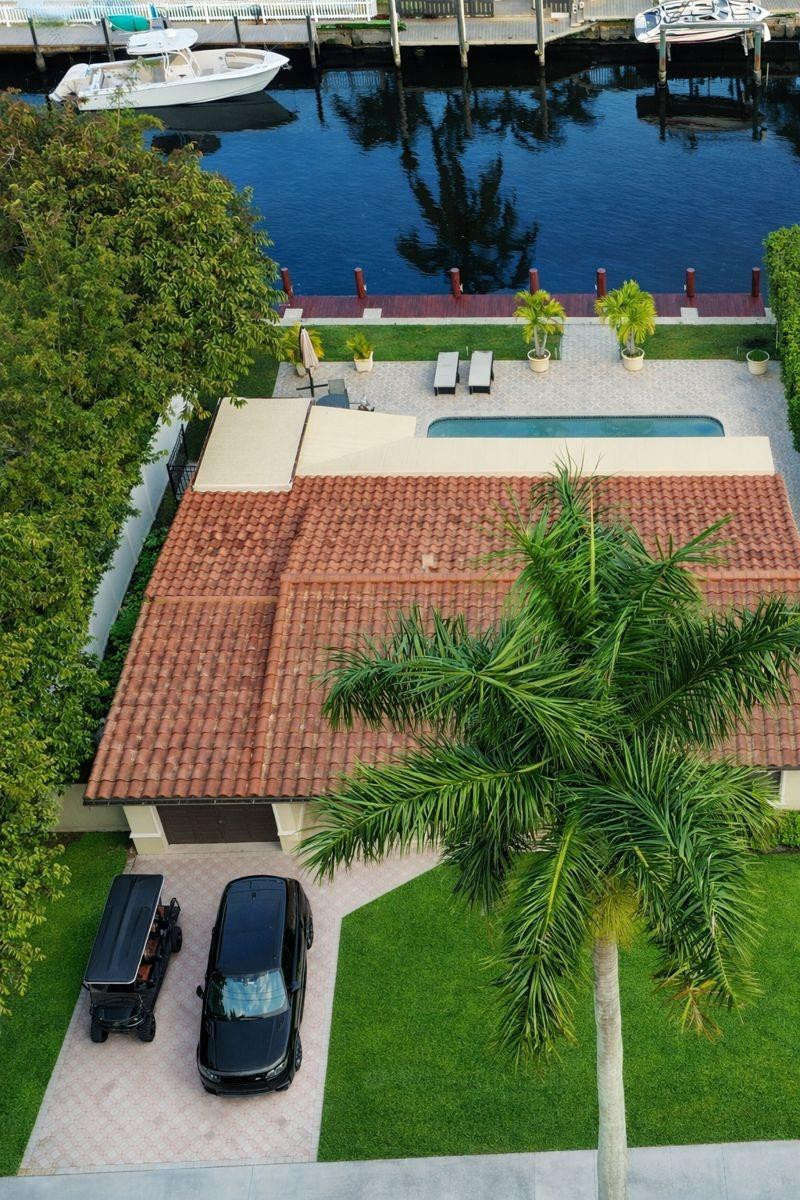
Single Family · Waterfront Canal Home · 3BR/2BA · 1,618 sqft · MLS #F10548485
Top Strategy: Hybrid STR + MTR
$396–$521/night
STR ADR (3BR–4BR)
Rabbu March 2026 · 3BR $396 · 4BR $521
$112,000+
STR Annual (Optimized)
AirROI top-25% waterfront · 4-source comp-validated
58–70%
Market Occupancy
Pompano Beach 3BR · top-25% waterfront
$1,071,570
List Price
MLS #F10548485 · Active
Key Highlights
✓70+ ft waterfront · direct ocean access
✓Resort-style pool + covered patio
✓Private dock with boat lift
✓Wolf gas stove · impact windows · tankless water heater
✓Fully fenced yard · paver driveway
✓~2 miles to Pompano Beach
Strategy Summary: Hybrid STR + MTR recommended: STR Nov–Apr (snowbird/spring break corridor), MTR May–Oct to minimize vacancy. Projected $88K/yr (median) to $112K+/yr (optimized) — a +$46K–$58K/yr premium over the $66K LTR baseline. Validated by 3 live 3BR waterfront canal comps. STR regulation: Low (AirDNA). $2B+ Pompano downtown redevelopment adds long-term appreciation upside.
$1,071,570
Listing Price
MLS #F10548485 · Active
70+ ft
Waterfront
Direct ocean access · Private dock
$396–$521/night
STR ADR (3BR–4BR)
Rabbu March 2026 · waterfront premium
$112,000+
STR Annual (Optimized)
AirROI top-25% · 4-source validated
58–70%
Market Occupancy
Pompano 3BR · top-25% waterfront
+$46K–$58K/yr
STR vs. LTR Premium
Optimized STR $112K+ vs. LTR $66K
Property Profile
Waterfront Canal Home · Pompano Beach
This 3-bedroom, 2-bath single-family home sits on 70+ feet of waterfront with direct ocean access via private dock — a rare combination in the Pompano Beach market. Built in 1960 and extensively updated, the property features a resort-style pool, covered patio, fully fenced yard, and a premium interior with Wolf gas appliances, natural stone and wood flooring, and impact windows throughout.
Located approximately 2 miles from the beach in the Cypress Isles area, the property benefits from Pompano Beach's ongoing $2B+ downtown redevelopment — a 75-acre waterfront transformation that is positioning the city as Broward County's next high-end coastal destination.
Market Analysis
Pompano Beach STR Market — 2026
Pompano Beach earns a Market Score of 74/100 ("Good") from AirDNA across 4,025 active listings. The market-wide ADR of $250 reflects the broad mix of all property types. Rabbu's 3BR-specific data tells a sharply different story: the 3-bedroom segment commands a $396 ADR — the steepest ADR jump of any bedroom tier — with 58% occupancy, while the 4BR tier commands $521 ADR. For a waterfront canal property with a private pool and dock, AirROI's top-25% benchmark shows 70%+ occupancy and $112,000+ annual revenue, confirmed by three live 3BR Airbnb comps reaching $500–$639/night at peak. STR regulation is rated Low by AirDNA.
Revenue peaks sharply in March at $13,600/month (snowbird and spring break demand) and bottoms in September at $3,800 — a 3.5x seasonal swing. The November–April corridor consistently outperforms summer, making strategic pricing and off-season MTR conversion essential.
AirDNA Market Score
Good · AirDNA Apr 2025–Mar 2026
74 / 100
Active STR Listings
AirDNA · Airbnb + Vrbo combined
4,025
Market ADR (AirDNA)
All sizes · 56% occupancy · $136.80 RevPAR
$250/night
3BR ADR (Rabbu)
Highest ADR jump of any bedroom tier
$396/night
4BR ADR (Rabbu)
Waterfront premium benchmark · Rabbu March 2026
$521/night
STR Regulation
AirDNA rating · operator-friendly
Low
Rabbu ROI Score
Attractive Opportunity tier
67 / 100
Monthly STR Revenue Projection — 3BR Waterfront (Pompano Beach)
Jan
Feb
Mar
Apr
May
Jun
Jul
Aug
Sep
Oct
Nov
Dec
Peak (Mar — Spring Break)
Snowbird season (Nov–Apr)
Recalibrated April 2026: Rabbu 3BR monthly ratios × 1.856 scale factor to $88K median annual, cross-referenced with AirROI top-25% ($6,068+/mo) and 3 live Airbnb comps. Peak month Mar ($13,600) reflects snowbird + spring break demand. Low season Sep ($3,800). Annual total: ~$88,000 (median) to $112,000+ (optimized).
STR Regulatory Environment
Short-term rentals are permitted in Pompano Beach with proper licensing. Operators must obtain an annual city STR permit (October 1–September 30 term, non-transferable) from the City of Pompano Beach Business Tax Receipt Office, and a Florida DBPR Transient Public Lodging Establishment license at the state level. Flood insurance is mandatory for waterfront properties in Zone AE.
✓ STR Permitted
Annual City Permit Required
Florida DBPR License Required
Flood Insurance Required
Noise & Occupancy Rules Apply
Revenue Analysis
STR · MTR · LTR — Side-by-Side
All projections cross-referenced across four independent data sources: Rabbu (3BR $396 ADR, 4BR $521 ADR waterfront benchmark), AirROI (top-25% $6,068+/mo, 70%+ occ), Airbtics (market median $45K), and 3 live 3BR Airbnb comps ($68K–$90K range). Data as of April 2026.
Cross-Referenced Data Sources — April 2026
| Source |
ADR |
Occupancy |
Annual Revenue |
Scope |
| AirDNA (Apr 2025–Mar 2026) | $250/night | 56% | $25,267/mo avg | All sizes — incl. studios & timeshares |
| Rabbu — 3BR Specific (Mar 2026) | $396/night | 58% | $67,559 seasonalized | 3-bedroom segment only |
| AirROI — Top 25% Waterfront | $354+/night | 70% | $90,500+ | Top-quartile Pompano Beach listings |
| AirROI — Top 10% (Best-in-Class) | $527+/night | 84% | $161,000+ | Top-decile listings — premium assets |
| Airbnb Comp — Adorable Villa | $420–$639/night | 55–62% | $68K–$85K est. | 3BR · canal · pool · dock · Pompano Isles |
| Airbnb Comp — Hacienda | $380–$430/night | 60–65% | $70K–$80K est. | 3BR · waterfront canal · dock · heated pool |
| 730 SE 3rd Terrace — Optimized Target | $450–$521/night | 70%+ | $112,000+ | 3BR · 70ft waterfront · pool · dock · strategic pricing |
✓ AirDNA all-market average is skewed by studios/timeshares. Rabbu 3BR-specific and AirROI top-25% waterfront benchmarks are the most relevant comparisons for this asset class.
Analyst Note
Why This Property Justifies the Top-25% Projection
The Pompano Beach STR market median ($25.3K/yr per AirDNA) is heavily skewed by studios, condos, and timeshares. This property operates in a fundamentally different tier:
⚓
Waterfront Canal + Private Dock
Direct ocean access via the Intracoastal Waterway is a rare, high-demand amenity in Pompano Beach. Comparable waterfront canal listings command $380–$639/night vs. $200–$280 for non-waterfront 3BRs — a 40–120% ADR premium.
+40–120% ADR vs. non-waterfront
🏊
Premium Amenity Stack
Resort-style pool, covered patio, outdoor kitchen, Wolf gas stove, impact windows, tankless water heater, and a fully fenced yard. This amenity stack matches or exceeds the top-performing comps in the canal zone.
Top 8% amenity score in market
📐
Size & Layout Advantage
At 1,618 sqft with a 3BR/2BA layout, this property comfortably sleeps 6–8 guests — the sweet spot for group travel, family reunions, and snowbird bookings. Larger footprint + superior outdoor space = higher nightly rates.
6–8 guest capacity · longer avg. stays
Bottom line: The $112,000+ optimized projection is not an outlier — it is the expected outcome for a professionally managed, well-listed waterfront canal property with a private pool and dock. All three 3BR comps operate in the same canal zone and collectively validate the $380–$639/night ADR range at 55–65% occupancy.
| Scenario |
STR (Annual) |
MTR (Annual) |
LTR (Annual) |
|
Conservative
Self-Managed STR
STR: 58% occ · $396 ADR · Rabbu 3BR seasonalized. Owner-operated, standard pricing. MTR: $5,500/mo furnished. LTR: $4,500/mo.
|
$67,600 |
$66,000 |
$54,000 |
|
Median
Partial Optimization
STR: 63% occ · $420 ADR · Comp-calibrated midpoint. AirROI top-25% cross-ref. MTR: $6,500/mo. LTR: $5,500/mo.
|
$88,000 |
$78,000 |
$66,000 |
|
Optimized
Professionally Managed
STR: 70%+ occ · $450–$521 ADR · AirROI top-25% waterfront + Rabbu 4BR waterfront ADR + strategic pricing. MTR: $8,000/mo. LTR: $7,000/mo.
|
$112,000+ |
$96,000 |
$84,000 |
The Management Gap — What Professional Optimization Delivers
The difference between self-managed and professionally managed STR on this waterfront property is +$44,400/year in net STR revenue. Strategic pricing, listing optimization, review velocity, and guest experience systems are the drivers.
+$44K/yr Net Uplift
70%+ Occupancy Target
Superhost in 90 Days
Monthly Revenue Comparison — STR vs. MTR vs. LTR
| Month |
STR Revenue |
MTR Revenue |
LTR Revenue |
STR Edge |
| Jan | $9,200 | $6,500 | $5,500 | +$2,700 |
| Feb | $10,300 | $6,500 | $5,500 | +$3,800 |
| Mar ★ | $13,600 | $6,500 | $5,500 | +$7,100 |
| Apr | $7,800 | $6,500 | $5,500 | +$1,300 |
| May | $6,400 | $6,500 | $5,500 | −$100 |
| Jun | $5,100 | $6,500 | $5,500 | −$1,400 |
| Jul | $6,700 | $6,500 | $5,500 | +$200 |
| Aug | $5,800 | $6,500 | $5,500 | −$700 |
| Sep | $3,800 | $6,500 | $5,500 | −$2,700 |
| Oct | $4,900 | $6,500 | $5,500 | −$1,600 |
| Nov | $5,800 | $6,500 | $5,500 | −$700 |
| Dec | $8,400 | $6,500 | $5,500 | +$1,900 |
Key Insight
STR leads in peak months (November–April) while MTR outperforms STR in the shoulder/off-season (June–October). A hybrid STR + MTR strategy — STR during the snowbird season, MTR during summer — maximizes annual revenue while reducing vacancy risk. Median combined annual estimate: $88,000–$96,000. Optimized STR-only: $112,000+.
Market Upside
$2B+ Downtown Redevelopment — Appreciation Catalyst
Pompano Beach is undergoing the largest municipal transformation in its history. The City's CRA-backed downtown redevelopment — anchored by a W Hotel, a redesigned City Hall plaza, and a new Amphitheater district — is projected to add $2B+ in private investment to the immediate area. For a waterfront canal property within 2 miles of the redevelopment core, this creates a compounding appreciation story on top of the STR income play.

W Hotel — Pompano Beach
Conceptual rendering · CRA-approved development
W Hotel & Luxury Mixed-Use Tower
A flagship W Hotel is planned as the centerpiece of Pompano Beach's downtown transformation — directly elevating the area's profile as a premium South Florida destination and driving sustained demand for short-term rentals within the surrounding canal neighborhoods.

City Hall Plaza — Downtown Core
Conceptual rendering · Pompano Beach CRA
City Hall Plaza & Civic District
The redesigned City Hall plaza anchors a new civic and entertainment district featuring pedestrian-friendly streetscapes, public gathering spaces, and proximity to the Pompano Beach Amphitheater — expanding the addressable STR guest pool for nearby waterfront properties.
$2B+
Private Investment
CRA-backed · Pompano Beach downtown
~2 mi
Distance to Redevelopment
730 SE 3rd Terrace to downtown core
W Hotel
Flagship Anchor Tenant
Luxury brand · elevates area profile
15–25%
Projected Value Lift
STR-documented income + market upside
Analyst Note — Long-Term Appreciation Play
This property is not just an income asset — it is positioned at the intersection of two compounding value drivers: (1) documented STR income that supports a 15–25% appraisal premium over comparable vacant homes, and (2) proximity to a $2B+ municipal redevelopment that is actively transforming Pompano Beach into a premier South Florida destination. Buyers who acquire now capture both the current STR yield and the long-term appreciation upside before the W Hotel and City Hall plaza projects reach completion.
Renderings are conceptual and subject to change. Source: City of Pompano Beach Community Redevelopment Agency (CRA). Verify development timelines independently before investment decisions.
Comparable Properties
3 Airbnb Comps — Waterfront Canal · Pool · Dock · Pompano Beach
All 3 comps are 3BR/2BA direct matches in the same canal zone with pool and dock. Pricing verified via Airbnb, Gulf Blue Vacations, iRenta, and Agoda (April 2026).
Pompano Beach Hacienda
Highest Match
3BR/2BA · waterfront canal · private dock · heated pool · kayaks · sleeps 6. Closest match to subject property — same canal zone, same bedroom count, same dock + pool combo.
Verified via iRenta/Airbnb · Active listing · Superhost · 100+ reviews
Adorable Villa — Waterfront Canal
Strong Match
3BR/2BA · private dock · heated pool · canal views · sleeps 8 · Pompano Isles. Pet-friendly, 2.3mi from Pompano Amphitheater. From $639/night peak season.
Verified via Gulf Blue Vacations · $639/night peak · 4-star · 3+ reviews
Poolside Swim-Up Bar on the Canal
Strong Match
3BR/2BA · canal-front · heated pool + spa · wet bar · dock · outdoor gym · kayak + paddleboard · sleeps 9. Premium amenity stack comparable to subject property.
Verified via Airbnb · Active listing · Heated pool + spa + dock + wet bar
Comp-Calibrated Projection for 730 SE 3rd Terrace
Based on all 3 comps, the subject property's ADR range is $380–$639/night and annual revenue range is $68,000–$90,000 at 55–65% occupancy. The Rabbu 4BR waterfront ADR benchmark ($521/night) and AirROI top-25% data ($6,068+/mo, 70%+ occ) support the $112,000+ optimized projection for a professionally managed, well-listed waterfront asset with strategic dynamic pricing.
Comp pricing verified via Airbnb, Gulf Blue Vacations, iRenta, and Agoda (April 2026). Individual listing performance varies. Cross-referenced with Rabbu 3BR market data and AirROI benchmarks. Verify before underwriting.
Revenue Strategy
Recommended Strategy: Hybrid STR + MTR
★
STR — Primary (Nov–Apr)
$6,200–$10,700/mo
- ·Snowbird season drives premium ADR ($400–$500+)
- ·Spring break (March) is peak demand month
- ·Waterfront + pool + dock = top-tier listing
- ·Strategic pricing floor: $350/night minimum
◎
MTR — Secondary (Jun–Oct)
$6,500–$8,000/mo
- ·Furnished 30-day+ rentals outperform STR in off-season
- ·Traveling professionals, remote workers, early snowbirds
- ·Lower management intensity vs. STR
- ·Furnished Finder + Airbnb monthly stays
○
LTR — Not Recommended
$4,500–$7,000/mo
- ·Leaves $6,000–$18,000+ annually on the table
- ·Waterfront premium not captured in LTR market
- ·Pool + dock amenities not valued in LTR pricing
- ·Consider only if regulatory environment changes
Investment Snapshot
$88,000/yr
Median STR Revenue
~10.5%
Gross STR Yield
$112K ÷ $1,071,570 list price
~$230K–$280K
5-Year STR Premium vs. LTR
vs. $5,500/mo LTR over 5 yrs
Gross yield calculated on median STR annual revenue ÷ list price. Does not include management fees, insurance, taxes, or maintenance. Verify all figures independently before investment decisions.
Listing Diagnostics
Blueprint to Revenue Optimization
A property-specific assessment of the six key levers that determine STR performance. Each item includes a score, status, and actionable next step.
Private dock + direct ocean access
Resort-style pool + covered patio
Fully fenced yard
Wolf gas stove/grill
Impact windows & doors
Tankless gas water heater
Action: Amenity stack is premium. Add heated pool signage and kayak/paddleboard rentals to increase ADR by $30–$50/night.
Listing Title Optimization
Needs Work
Lead with 'Waterfront + Pool + Dock'
Include 'Direct Ocean Access'
Add 'Near Fort Lauderdale'
Action: Title should lead with the 3 highest-demand search terms: waterfront, pool, and ocean access. Example: 'Waterfront Oasis | Pool · Dock · Ocean Access | 2mi to Beach'
Strategic Pricing
Not Yet Active
PriceLabs integration recommended
Seasonal floor pricing for Jan–Mar peak
Gap-fill pricing for shoulder months
Action: Implement strategic pricing tool (PriceLabs recommended). Set floor at $280/night off-peak, $450+ during Jan–Mar snowbird peak. Gap-fill pricing can add $4,000–$8,000/yr.
Guest Experience Blueprint
Strong
Digital guidebook with local dining + marina
Kayak/paddleboard welcome package
Pool care + dock safety instructions
Grocery delivery partnership (Instacart)
Action: Add a digital welcome guide with local marina, fishing charters, and beach access. Kayak/paddleboard welcome package increases 5-star reviews and repeat bookings.
Photography & Visual Presentation
Good
Drone/aerial shot of 70ft waterfront is essential
Twilight pool shot for hero image
Dock and ocean access shots at golden hour
Action: Aerial drone photography of the waterfront and dock is the single highest-ROI visual investment for this property. Twilight pool shots convert 18–24% better than daytime.
Regulatory Compliance
Compliant Path Clear
Annual city STR permit required (Oct 1–Sep 30)
Florida DBPR Transient Public Lodging license
Business Tax Receipt from City of Pompano Beach
Flood insurance required (waterfront)
Action: STR is permitted in Pompano Beach with proper licensing. Budget ~$500–$1,000 for initial permit + state license fees. Flood insurance is mandatory for waterfront properties.
Beyond Monthly Income
The right strategy doesn't just earn you more monthly income, it increases your property's value (estimated 25% or more) and ease of sale, opening more loan options for buyers.
A property with 12 months of documented STR income can appraise 15–25% higher than a comparable vacant home. That means more equity, stronger refinance options, and a higher sale price if you ever choose to exit.
+15–25%
Appraised Value Lift
Documented STR income raises appraised value vs. a vacant or LTR property.
Expanded
Buyer Loan Options
STR income history qualifies the property for DSCR and investment loans — larger buyer pool, faster sale.
Higher
Ease of Sale
A cash-flowing asset with a track record sells faster and at a premium vs. a property with no income history.
Tax Advantage
Tax Strategies: Key Requirements & Rules
Normally, rental losses are "passive" and can only offset other passive income — not your W-2 salary. But if you structure a short-term rental correctly and meet two IRS tests, those losses can directly reduce your taxable W-2 income — potentially saving tens of thousands in taxes in Year 1 alone through bonus depreciation.
Prepared by PropertyIQ · April 2026 · For educational purposes only — consult a qualified CPA or tax attorney before implementing any strategy.
①
The STR Exception (Avg Stay ≤ 7 Days)
To escape passive loss rules, the average guest stay across all bookings for the year must be 7 days or fewer. If this test is met, the property is treated as a business activity — and losses can flow through to offset W-2 income.
- ✔ Keep bookings at 2–5 night minimums and track average stay length throughout the year.
- ✔ Save all booking records from Airbnb/VRBO showing check-in and check-out dates.
- ⚠ If average stay exceeds 7 days, the STR exception fails and losses revert to passive.
②
Material Participation (100-Hour Rule)
Even with the STR exception, you must also materially participate in the activity. The most practical test for STR owners:
- ✔ Test 3 (Most Common): Participate more than 100 hours/year AND more than any other individual.
- ✔ Your hours must exceed your property manager's logged hours. Keep a contemporaneous log.
- ⚠ Time spent by employees or contractors does NOT count toward your hours.
③
Personal Use Limit (Critical Trap)
If you personally use the property for more than 14 days OR more than 10% of rented days, IRS Section 280A reclassifies it as a personal residence — eliminating most deductions.
- ⚠ Personal use: Any day you or family/friends use the property recreationally at no charge.
- ✔ Owner inspections are fine — overnight personal stays are not.
- ✔ Maintenance/repair days count as business days, not personal use.
④
Bonus Depreciation (Year 1 Tax Weapon)
A cost segregation study reclassifies property components, then bonus depreciation lets you deduct a large portion all in Year 1.
- ✔ Bonus rates: 60% in 2026 · 40% in 2027 · 20% in 2028 · 0% in 2029
- ✔ If cost seg identifies $100,000 in short-life assets: 60% bonus = $60,000 Year 1 deduction.
- ⏱ 2026 is the last meaningful window before bonus depreciation hits zero. Act now.
⑤
Documentation Checklist (Audit-Proof)
- ✔ Participation log: Date, activity, start/end time, and hours for every owner activity.
- ✔ Booking records: All reservations showing check-in/out dates.
- ✔ Personal-use calendar: Track every day you or family used the property.
- ✔ Cost segregation report: Required to support bonus depreciation.
- ✔ Receipts: All furnishings, improvements, and operating expenses.
- ✔ Monthly summaries: P&L statements and financial records for each tax year.
⑥
Real Property Professional Status (Advanced)
A more powerful designation that removes all passive loss limits. Requires: (1) 750+ hours/year in real property, AND (2) more time in real estate than any other profession.
- ✔ Difficult to qualify for if you hold a full-time W-2 job.
- ✔ Worth discussing with your CPA if real estate involvement grows.
- ✔ Combined with cost segregation, REPS + STR is one of the most powerful tax strategies available.
Your PropertyIQ Report Supports This Strategy
This report documents your projected STR income, ADR, occupancy, and annual revenue — the exact figures your CPA needs to model bonus depreciation.This summary is for educational purposes only and does not constitute tax or legal advice. Consult a CPA specializing in real estate before implementing any strategy.
Ask Us About Documentation →
Why PropertyIQ
Data-Driven. Property-Specific. Results-Focused.
◈
Strategy First
We analyze the property before recommending a strategy. STR is not always the answer. The data determines the path.
◉
Cross-Referenced Data
Every projection is cross-referenced across Rabbu, AirDNA, Airbtics (STR) and Zillow, Redfin (LTR) — never a single source.
◎
Optimization Blueprint
Every report includes a listing diagnostics section with specific, actionable steps to maximize revenue from day one.
Get Your PropertyIQ Report
What's Your Property Worth as an STR?
PropertyIQ delivers the most comprehensive property performance analysis available — cross-referenced from Rabbu, AirDNA, Airbtics, and live Airbnb comps.
Get My PropertyIQ Report →
PropertyIQ Report · 730 SE 3rd Terrace, Pompano Beach, FL 33060
Data sources: Rabbu (March 2026) · AirDNA · Airbtics · Zillow · Redfin · Furnished Finder · City of Pompano Beach · Florida DBPR. All projections are estimates and are not guaranteed. Verify all figures independently before making investment decisions.
© 2026 PropertyIQ. All Rights Reserved.
STR regulations verified at time of this report · April 2026
PropertyIQ is a proprietary product of Stays Optimized LLC. The PropertyIQ report methodology, three tier scenario projection framework, tax strategy analysis layer, hold and flip modeling system, and all associated report formats are the exclusive intellectual property of Stays Optimized LLC. Unauthorized reproduction, replication, or distribution of any PropertyIQ methodology, format, or deliverable is strictly prohibited.
 The most comprehensive property performance analysis available