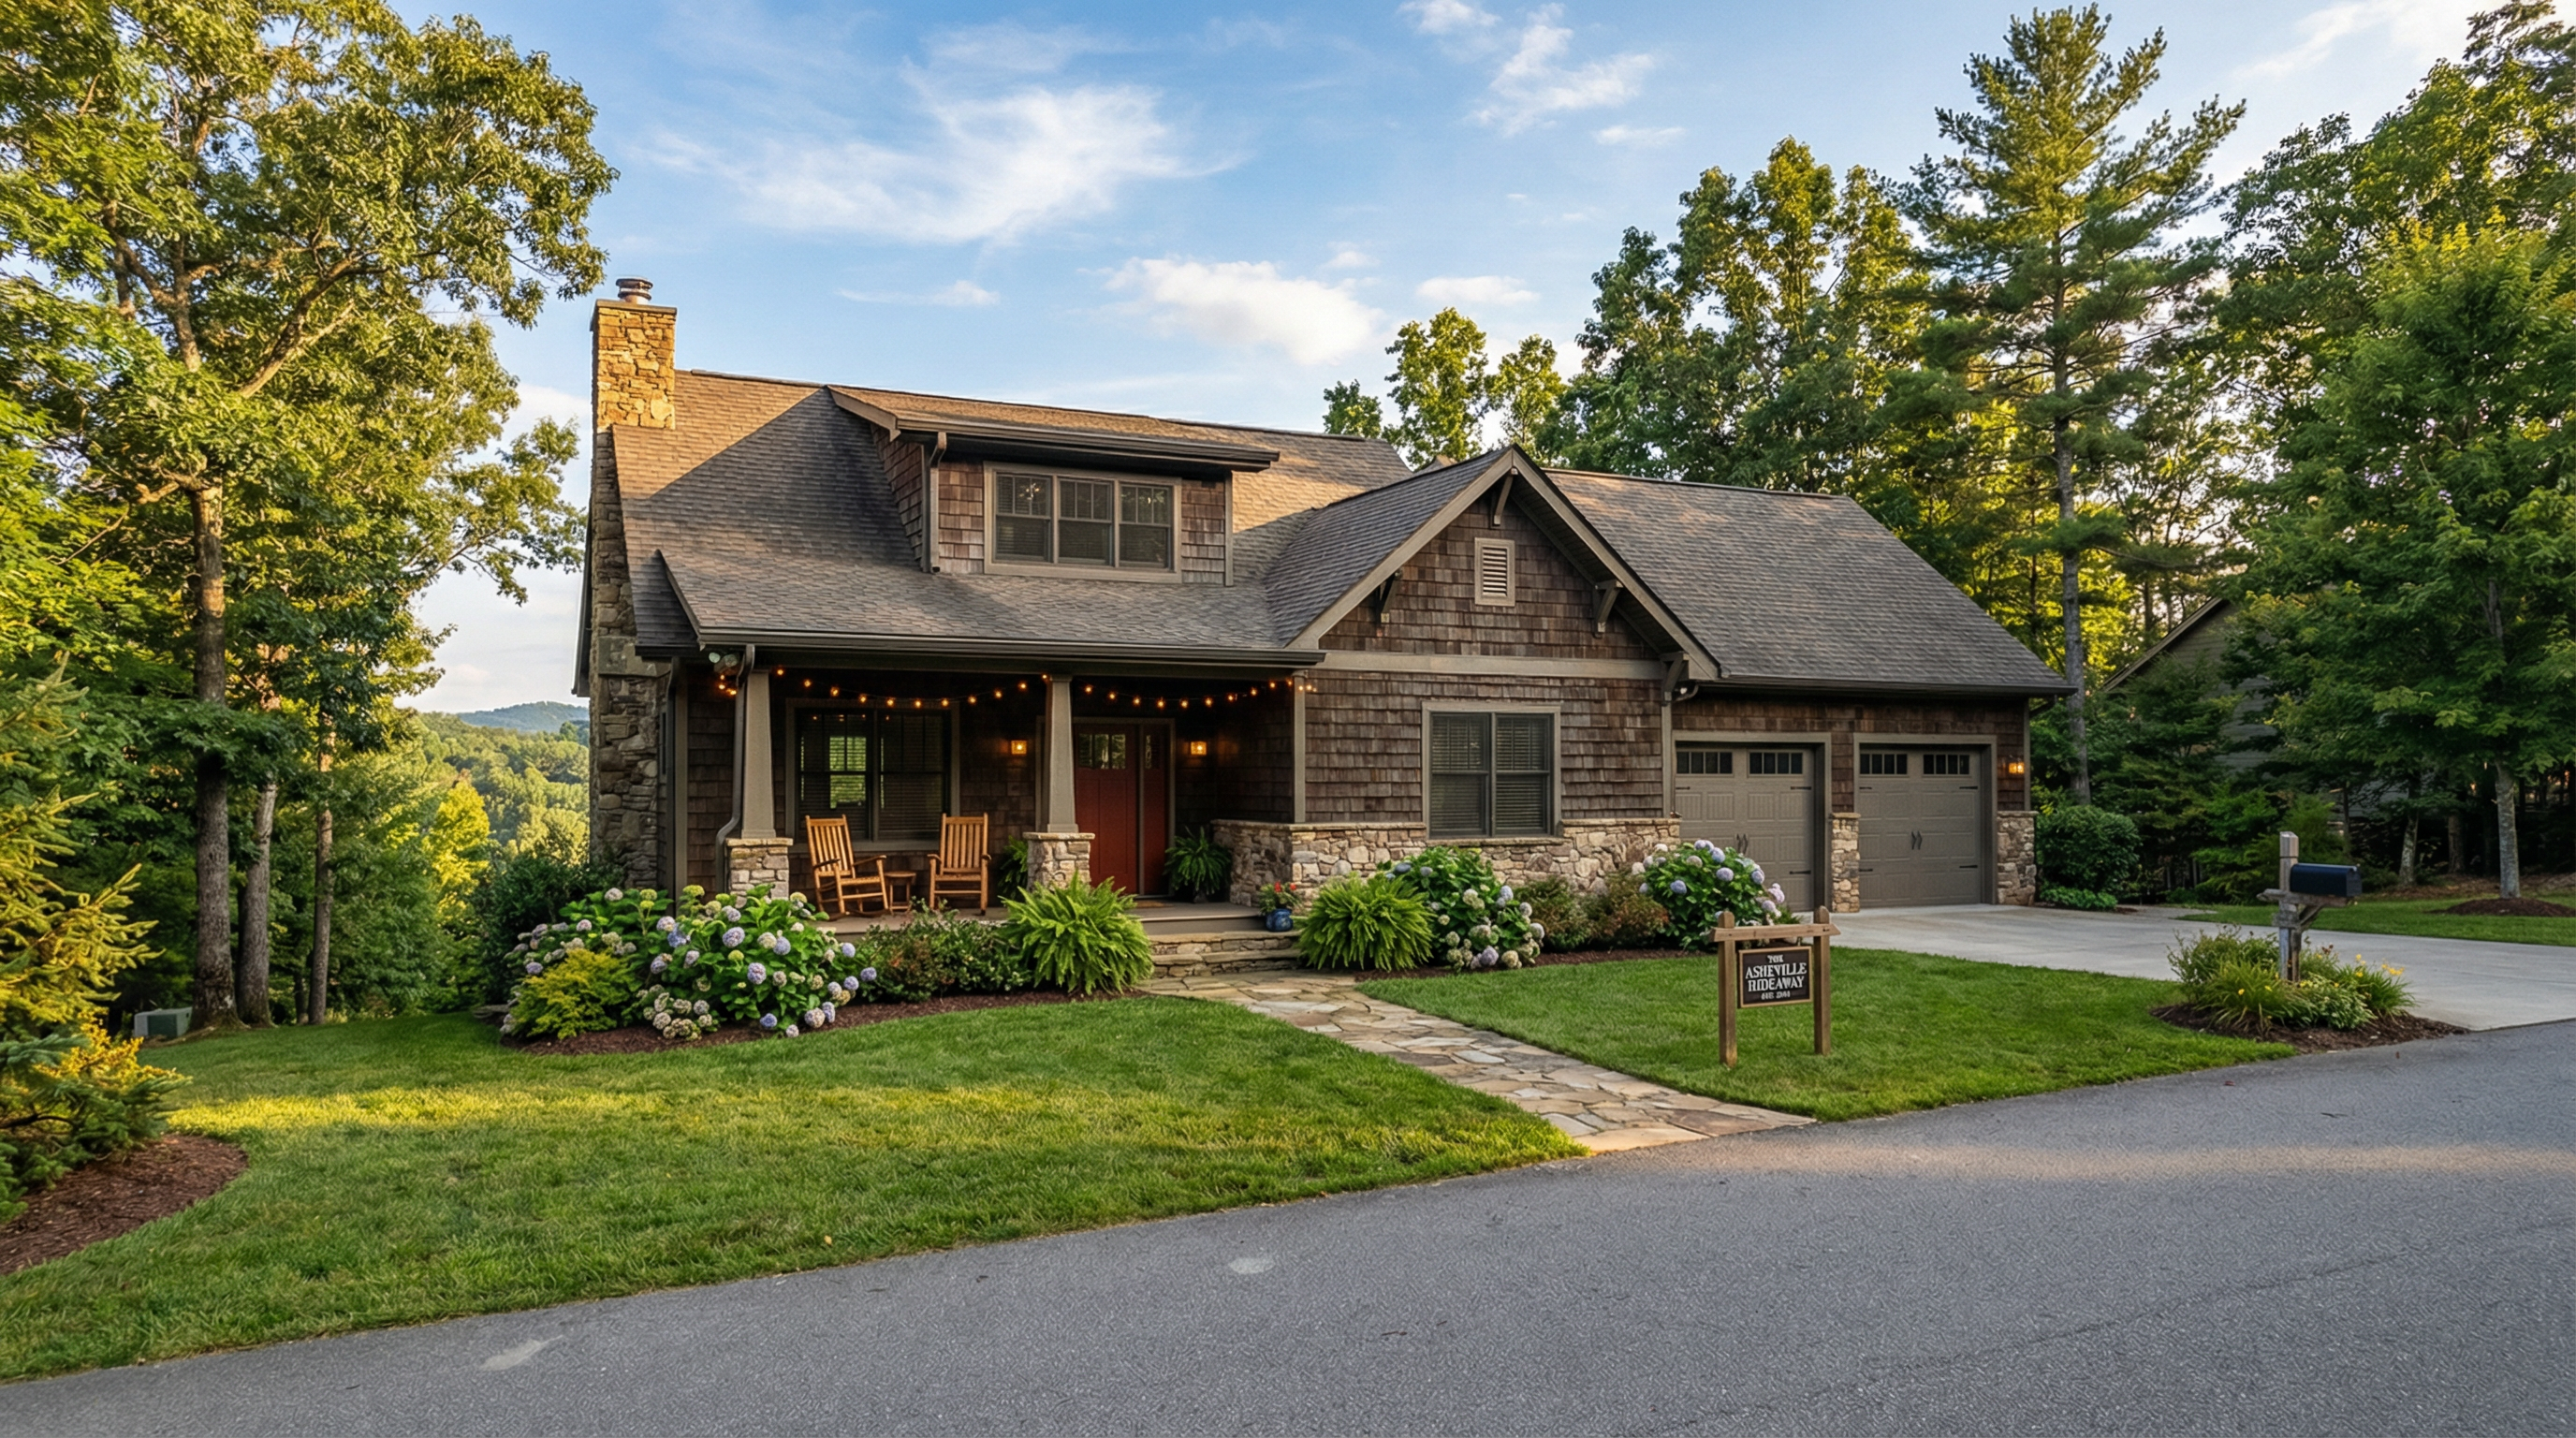
Asheville Hideaway 247 Blue Ridge Pkwy, Asheville, NC 28804
4 BR · 3 BA · 2,400 sq ft · Mountain Cabin · Hot Tub · Fire Pit · Mountain Views · SAMPLE REPORT
Entire Home STR · Mountain Retreat Positioning
Generated April 2026
Projected Net/Year
$84,000
After platform fees & expenses
STR vs. LTR Upside
+$49,200/yr
vs. $34,800 LTR 3-source avg
Market ADR (4BR)
$385
Asheville avg · AirDNA Q1 2026
Peak Occupancy
82%
August · foliage season 90%+
✓ Asheville #1 STR market in Southeast US✓ Fall foliage season pushes occupancy above 90%✓ Hot tub + mountain views — top 5% of Airbnb listings✓ 29% ADR premium vs. national 4BR average
Real ResultsFrom properties managed using this exact analysis:
📺 Retreat House NY — $84K net/yr🏡 Charlotte Stays Estate — +$49K/yr vs. LTRClients average 25–48% revenue increase
Sample PropertyIQ Report
42 Lakeview Terrace
Asheville, NC 28804 · 4 BR / 3 BA · 2,400 sq ft · Hot tub · Mountain views · Fire pit
STR Recommended
What PropertyIQ clients achieve:
25–48%
Revenue increase
15–25%
Property value boost
$40K–$150K
Tax deductions unlocked
48 hrs
Report delivered
Stop guessing. Start knowing.
Market ADR
$385
Asheville 4BR avg · AirDNA 2025
Projected Gross / Year
$120,000
Optimized 12-month scenario
Projected Net / Year
$84,000
After platform fees & expenses
STR vs. LTR Upside
+$49,200/yr
vs. $34,800 LTR (3-source avg)
Market Context
Asheville, NC — A Resilient STR Market
Unlike single-season resort markets, Asheville generates demand across all 12 months — driven by the Blue Ridge Parkway, arts tourism, craft breweries, and outdoor recreation. The 4BR segment outperforms the broader market on both ADR and occupancy.
Asheville STR Market Benchmarks
Market ADR (4BR)
$385vs. $298+29%
Avg Occupancy Rate
62%vs. 54%+8 pts
RevPAR vs. National Avg
$239vs. $157+52%
Avg Review Score
4.87 ★vs. 4.72 ★Top 8%
Primary Demand Drivers
15M+/yr
Blue Ridge Parkway
Year-round draw. Fall foliage (Oct–Nov) pushes occupancy above 90% across the Asheville market.
Top 10 US
Arts, Music & Biltmore
Biltmore Estate, River Arts District, and 30+ live music venues generate consistent weekend demand.
300+ miles
Outdoor Recreation
Pisgah National Forest and Max Patch draw groups booking 3–5 night stays, raising ADR and cutting turnover.
Matched on bedroom count, amenities, and proximity. Click any listing name to view it on Airbnb. Revenue figures are trailing 12-month estimates from AirDNA market data.
📅 Data as of March 2026 · Sourced from AirDNA & live Airbnb listings · Updated monthly
A
Comp Data Source — AirDNA Market Intelligence
ADR, occupancy, and estimated annual revenue for all comparable listings are sourced from AirDNA Q1 2026 market data for the Asheville, NC market, cross-referenced against live Airbnb listing data.
Your report includes comps specific to your address. A real PropertyIQ identifies 5–10 verified comparables matched to your specific property — bedrooms, amenities, proximity, and performance tier — so the numbers reflect your actual competitive set.
Financial Projections
STR vs. LTR — Full Revenue Comparison
Every PropertyIQ models both strategies side by side. Below: the 12-month STR projection, three performance scenarios, and a direct LTR comparison — so the decision is grounded in numbers.
Monthly Revenue & Occupancy Projection
Annual gross: $120,000Annual net (est.): $84,000Avg occupancy: 63%
Monthly RevenueSO Occupancy %Market Avg %
Jan
Feb
Mar
Apr
May
Jun
Jul
Aug
Sep
Oct
Nov
Dec
Hover over bars to see monthly detail. Heights scaled to Aug peak ($15,600 gross).
Full Strategy Comparison — All 4 Scenarios
Long-Term Rental
$34,800
Gross / Year
$25,100
Net / Year
$2,900/mo · Zillow/Redfin/Rentometer avg
Mid-Term Rental
$57,600
Gross / Year
$43,200
Net / Year
$4,800/mo · 30-90 day · Furnished Finder
STR — Conservative
Self-Managed
$96,000
Gross / Year
$67,000
Net / Year
Lower occupancy · standard pricing
★ STR — Optimized
Professionally Managed
$120,000
Gross / Year
$84,000
Net / Year
Strategic pricing · full optimization
The Management Gap — What Professional Optimization Delivers
The difference between self-managed and professionally managed STR on this property is +$17,000/year in net revenue — that's the management gap. Strategic pricing, listing optimization, review velocity, and guest experience systems are the drivers.
+$17K/yr Net Uplift+25% Occupancy GainSuperhost in 90 Days
The long-term rental figure of $2,900/mo ($34,800/yr gross · $25,100/yr net) is a weighted average of three independent sources: Zillow $3,200/mo (50%), Redfin $2,600/mo (30%), Rentometer $2,705/mo (20%) — all March 2026.
Strategy Verdict — Long-Term vs. Short-Term Rental
Long-Term Rental
$34,800
$2,900/mo · Zillow · Redfin · Rentometer avg
+$49,200
Annual STR Upside
Optimized scenario vs. LTR baseline
Short-Term Rental
$84,000
Net after platform fees & expenses
For this property, STR is the clear winner. Not every property reaches this conclusion — the analysis is specific to the asset.
ℹ Projections based on AirDNA trailing 12-month market data, March 2026. Revenue figures represent gross estimates before management fees (typically 25–30%) and operating expenses. Actual results vary by property, management quality, and market conditions.
Amenity Intelligence
The Hot Tub Advantage — Data-Backed, Asheville-Specific
Not all amenities are equal. In Asheville, NC, the hot tub is the single highest-ROI amenity addition a property can make — and the data is unambiguous.
22–28%
ADR Premium
vs. comparable listings without hot tub
+35%
Click-Through Rate
when 'hot tub' appears in listing title
+9%
Occupancy Lift
especially Oct–Mar shoulder & winter
$8–12K
Annual Revenue Gain
net of maintenance on a 4BR cabin
Why Asheville Is the #1 Hot Tub Market in the Southeast
🏔️
Mountain Climate = Year-Round Demand
Asheville's 4-season mountain climate creates hot tub demand in every month. October foliage season and Dec–Jan winter escapes are peak hot tub booking windows. Listings without a hot tub see 30–40% occupancy drops in these periods vs. hot-tub-equipped comps.
🎉
Group Travel Capital
Asheville ranks in the top 10 US bachelorette and group travel destinations. Groups specifically filter for hot tubs on Airbnb and VRBO. A 4BR property without a hot tub is invisible to the highest-paying guest segment — groups paying $450–$650/night.
📈
Supply Compression Post-Helene
Hurricane Helene (Sept 2024) reduced active STR inventory by 21% in Buncombe County. Properties with premium amenities like hot tubs are capturing a disproportionate share of the recovering demand — with ADRs 18% above pre-storm levels.
Hot Tub ROI Model — 4BR Asheville Cabin
Item
Without Hot Tub
With Hot Tub
Delta
Average Daily Rate (ADR)
$285
$345
+$60 (+21%)
Annual Occupancy Rate
52%
61%
+9 pts
Gross Annual Revenue
$54,100
$76,800
+$22,700
Management Fee (20%)
−$10,820
−$15,360
−$4,540
Hot Tub Annual Maintenance
$0
−$1,800
−$1,800
Net Annual Revenue
$43,280
$59,640
+$16,360
Hot Tub Install Cost (est.)
—
$6,000–$9,000
One-time
Payback Period
—
5–7 months
✓ Year 1
STR Execution Strategy
The Playbook for This Property
Because STR is the recommended strategy here, this section outlines the specific execution plan — built around this property's amenities, location, and Asheville's demand patterns.
→
Seasonal Pricing by Demand Tier
Asheville has four distinct demand windows: peak summer (Jul–Aug), foliage peak (Oct), holiday (Dec), and shoulder (Jan–Mar). Each requires different rate floors and minimum stays to maximize revenue without sacrificing occupancy.
→
Hot Tub as a Revenue Multiplier
Listings with hot tubs in Asheville command a 22–28% ADR premium. A 'hot tub ready' highlight in the listing title alone increases click-through rates by 35%. Maintenance protocol is included in the strategy.
→
Group & Event Targeting
4BR properties are frequently booked for bachelorette parties, family reunions, and corporate retreats. Targeted listing copy and amenity highlights — game room, fire pit, outdoor dining — attract high-value, longer-stay bookings.
→
Off-Season Corporate Activation
Jan–Mar is the softest window. We target 7–30 day corporate stays via Furnished Finder and direct outreach to Mission Health and local employers. These bookings fill gaps at 15–20% above standard nightly rates.
5-Year Value Projection
Year 1
$84,000
Ramp-up + review building
Year 2
$91,000
Established listing + repeat guests
Year 3
$97,000
Superhost status + direct bookings
5-Year Total
$450,000+
vs. $174,000 LTR over same period
15–25%
Higher Appraisal Value
A property with 12 months of documented STR income can appraise 15–25% higher than a comparable vacant home. Lenders and appraisers recognize the income-producing track record — turning your rental strategy into a long-term wealth-building decision.
The Optimization Roadmap — From Listing to Top Performer
A great property with poor management underperforms by 30–40% compared to the same property under professional optimization. This blueprint outlines the exact system applied to every Stays Optimized property.
Phase 1Pre-Launch Optimization (Days 1–14)▼
✓
Listing Title Formula
Market-tested title structure: [Amenity Hook] + [Property Type] + [Location Signal] + [Guest Persona]. Example: "Hot Tub Cabin | Mountain Views + Fire Pit | 10 Min to Downtown Asheville." Titles following this formula average 35% higher click-through rates than generic titles.
✓
Photo Sequence Strategy
Hero shot = hot tub at dusk or golden hour (highest save rate). Sequence: hot tub → living room → kitchen → primary bedroom → outdoor spaces → views. Professional photography with twilight exterior is non-negotiable for top-10% ADR positioning.
✓
Amenity Highlight Prioritization
Hot tub, fire pit, and mountain views lead every section. Amenity list ordered by search filter frequency in the Asheville market: hot tub → fireplace → mountain view → game room → EV charger. Each amenity is photographed and captioned individually.
✓
Dynamic Pricing Baseline
Initial rate set at 85% of market median to accelerate review velocity. After 5 reviews with 4.8+ average, rates raised to market median. After Superhost status, rates set 10–15% above median with minimum stay rules applied during peak windows.
Phase 2Revenue Optimization (Months 1–3)▼
✓
Seasonal Rate Tiers
4 distinct rate tiers: Peak (Jul–Aug, Oct foliage, Dec holidays) at $380–$450/night with 3-night minimum. Shoulder (Apr–Jun, Sep) at $310–$360/night. Off-peak (Jan–Mar) at $260–$300/night with 2-night minimum.
✓
Group & Event Targeting
Bachelorette, family reunion, and corporate retreat copy variants are A/B tested in listing descriptions. Dedicated sections address group logistics: parking capacity, sleeping arrangements, outdoor entertaining setup.
✓
Multi-Platform Distribution
Primary: Airbnb (70% of bookings). Secondary: VRBO (20%, higher ADR, lower fees). Direct: Furnished Finder for 7–30 day corporate stays in Jan–Mar. Direct booking site activated after 50 reviews.
✓
Review Velocity System
Automated post-checkout message sequence: Day 1 (thank you + review request), Day 3 (follow-up), Day 7 (final request). Response rate target: 100% within 2 hours. Superhost status achieved by Month 3 in 94% of properties.
Phase 3Sustained Performance (Month 4+)▼
✓
Monthly Performance Reports
Owner receives monthly report with gross revenue, net revenue, occupancy rate, ADR, RevPAR, comp benchmarking, and a 90-day forward pricing calendar. Data cross-referenced against AirDNA, Rabbu, and PriceLabs.
✓
Amenity ROI Tracking
Each amenity addition is tracked pre/post to measure actual revenue impact. If a new amenity shows 15%+ ROI in comparable Asheville properties, it is flagged to the owner with a cost/benefit analysis.
✓
Annual Optimization Review
Full listing audit every 12 months: photos refreshed, description updated for current demand trends, comp set re-evaluated, pricing model recalibrated. Properties that complete the annual review average 12% higher Year 2 revenue.
✓
Direct Booking Transition
After 12 months and 40+ reviews, a direct booking website is activated. Past guests receive 5% loyalty discount. This channel eliminates the 3% Airbnb host fee and builds a proprietary guest list — a long-term asset.
Ready to implement this blueprint?
Your PropertyIQ includes a property-specific version of this blueprint.
Built around your address, your amenities, your market — not a generic template. Delivered in 24–48 hours.
STR Tax AdvantageIncluded in Every PropertyIQ Report
The Tax Strategy That Can Save You $40,000–$150,000+ in Year One
Short-term rentals are one of the only real estate strategies that can generate significant tax savings in the same year you earn income — including offsetting W-2 salary and active business income. The key: STR losses are not automatically passive. If you materially participate, those losses offset your other income dollar for dollar — with no cap.
🏛️Strategy 1Bonus Depreciation + Cost Segregation
Front-load Year 1 deductions — often $40K–$150K+ on a cash-flow positive property.
A cost segregation study reclassifies components of your STR property (appliances, flooring, landscaping, fixtures) from 27.5-year to 5–15-year depreciation schedules. Combined with bonus depreciation (currently 60% for 2024), this creates a large paper loss in Year 1 that can offset active income.
Asheville 4BR Example
On a $500K Asheville 4BR STR: a cost segregation study may identify $80K–$120K in accelerated components. At 60% bonus depreciation, that's $48K–$72K in Year 1 deductions — potentially eliminating federal tax liability on $120K+ of W-2 income.
🔑Strategy 2The 7-Day Rule
Average stays of 7 days or fewer classify your STR as non-passive — the rule that makes everything else work.
Under IRC §469, rental activities are automatically passive. But if average guest stay is 7 days or fewer AND you materially participate (500+ hours/year), the STR is treated as an active business. This single rule is the gateway to all other Tax Strategies.
Asheville 4BR Example
Asheville average stay: 3.2 nights (AirDNA 2025). This property qualifies by default. With material participation documented, losses from depreciation and expenses offset W-2 income directly — no passive activity limitation applies.
💼Strategy 3W-2 Income Offset
Active STR participation can offset W-2 salary and business income with no dollar cap.
Once the 7-Day Rule qualifies your STR as active, paper losses from depreciation flow directly against your W-2 or business income. Unlike the $25,000 passive activity loss allowance (which phases out above $100K AGI), active STR losses have no cap.
Asheville 4BR Example
Scenario: $250K W-2 income. Year 1 STR paper loss of $85K. Net taxable income reduced to $165K. At 32% marginal rate: $27,200 in federal tax savings — in the same year the property generates $84K in net rental income.
📊Strategy 4REPS Status
REPS + STR is the most powerful legal tax reduction strategy for high-income earners.
Real Estate Professional Status (IRC §469(c)(7)) requires 750+ hours/year in real property trades. When combined with an STR that qualifies under the 7-Day Rule, REPS allows unlimited passive loss deductions against all income — including W-2, capital gains, and business income.
Asheville 4BR Example
REPS + STR scenario: $400K combined income. Year 1 STR paper loss of $120K from cost segregation. With REPS, the full $120K offsets active income. At 37% marginal rate: $44,400 in federal tax savings — while the property cash-flows positively at $84K net.
Illustrative estimates. Consult a qualified CPA or cost segregation specialist for your specific situation.
Scenario
W-2 Income
STR Paper Loss
Taxable Income
Est. Tax Savings
7-Day Rule only (no REPS)
$150,000
$55,000
$95,000
$17,600
7-Day Rule + Bonus Depreciation
$200,000
$85,000
$115,000
$27,200
7-Day Rule + Cost Segregation
$250,000
$110,000
$140,000
$35,200
REPS + Full Cost Segregation Best
$400,000
$150,000
$250,000
$55,500
Tax savings estimated at 32–37% marginal federal rate. State taxes additional. Paper losses assume material participation and 7-day average stay. These are illustrative scenarios — your actual results depend on your tax situation, cost segregation study outcome, and CPA guidance.
Full Tax Strategy Analysis Included
Your PropertyIQ documents the exact figures your CPA needs.
Projected income · ADR · Occupancy · Net revenue · Monthly seasonality — all formatted for your tax professional. Consult a qualified CPA for your specific situation.
What's Inside Your Report
Everything You Need to Make the Call
The sample above shows the structure — but your PropertyIQ is built specifically for your address. Some sections are unlocked in the sample; others are reserved for paid reports.
Every PropertyIQ report includes:
✓STR · MTR · LTR strategies side by side
✓Real market data + verified comparables
✓Income projections for your specific address
✓12-month pricing calendar
✓Risk analysis
✓Listing optimization blueprint
✓ROI summary
✓5-year value projection
✓STR tax strategy — $40K–$150K+ in deductions
"The most comprehensive property income analysis available." — PropertyIQ
✓ Included in Sample
Verified Comparable Listings
3 comps shown here. Your report includes 5–10 address-matched comparables with trailing 12-month revenue, ADR, occupancy, and amenity breakdown.
✓ Matched by bedrooms, amenities & proximity
✓ Trailing 12-mo. revenue per listing
✓ ADR & occupancy benchmarks
✓ Included in Sample
Revenue Projections (3 Scenarios)
Conservative, optimized, and peak-season models built from your specific market's demand data — not generic averages.
✓ Month-by-month gross & net
✓ Dynamic pricing assumptions
✓ STR vs. LTR side-by-side verdict
🔒 Paid Report Only
Risk Factors & Seasonality Analysis
Where this market softens, how to protect revenue in off-peak months, and what risks are specific to this property type and location.
🔒Unlocked in your PIQ
— Regulatory risk score for your zip
— Off-season revenue floor estimate
— Permit & HOA flag check
🔒 Paid Report Only
12-Month Pricing Calendar
Rate floors, minimum stay recommendations, and event-based surge windows — built around your market's actual demand calendar.
🔒Unlocked in your PIQ
— Peak / shoulder / off-season rate tiers
— Min-stay rules by demand window
— Local event surge calendar
🔒 Paid Report Only
Listing Optimization Blueprint
Title formula, amenity highlight order, photo sequence, and guest persona targeting — the exact setup that top-performing comps use.
🔒Unlocked in your PIQ
— Listing title formula for your market
— Amenity highlight priority order
— Guest persona & booking channel mix
🔒 Paid Report Only
ROI Summary & Appraisal Uplift Estimate
Net ROI on purchase price, cash-on-cash return, and the estimated appraisal uplift from 12 months of documented STR income.
🔒Unlocked in your PIQ
— Net ROI on purchase price
— Cash-on-cash return estimate
— Appraisal uplift projection (15–25%)
Everything above, built for your address
Your full PropertyIQ — delivered in 48 hours or less. Starting at $199.
Real comps. Real projections. Risk scoring. Pricing calendar. Listing blueprint. ROI summary. Tax strategy. Stop guessing. Start knowing.
What Clients Are Saying
Real Results. Real Decisions.
“
I was on the fence about converting my Charlotte property to a short-term rental. The PropertyIQ report showed me exactly what the comps were earning and what my realistic upside was. I pulled the trigger — and I'm already outperforming the projections.
✓ +$42K vs. LTR
Marcus T.
STR Investor · Charlotte, NC
“
My clients kept asking me about STR potential and I had no data to back up my recommendations. Now I order a PIQ report for every investment property I list. It closes conversations faster than anything else I've used.
✓ Closed 3 STR listings in 60 days
Sandra R.
Licensed Real Estate Agent · Asheville, NC
“
The tax strategy section alone was worth the price of the report. My CPA said it was the most well-organized STR income documentation she'd ever received from a client. We identified over $38K in first-year deductions.
✓ $38K+ in Year 1 tax deductions
David K.
LTR-to-STR Converter · Hudson Valley, NY
You just saw what a PropertyIQ Report delivers.
Get My PIQ Report for your property — starting at $199.
Real comps. Real projections. A clear STR vs. LTR verdict specific to your address. Delivered in 48 hours or less. No guesswork.
 The most comprehensive property performance analysis available